
AI coding agents, at the edge of your screen.
Jervis Agent Deck brings available usage readings, active agent sessions and pending requests into a local dashboard and an edge widget. Keep your coding agents in sight without leaving your workflow.

Everything important, in one glance.
A small always-on view of your agents. See usage, activity, pending questions, and requests without interrupting your active mental flow.
LIVE STATUS
Follow session activity from supported agent integrations. Configure hooks in Settings to start receiving events.
NEEDS YOU
See pending input and approval requests when a supported integration reports them.
STAY IN CONTROL
Open the dashboard with Ctrl/Cmd+Shift+J to inspect agents, usage and monitoring settings.
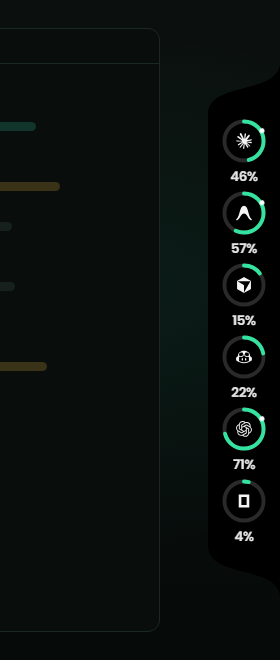
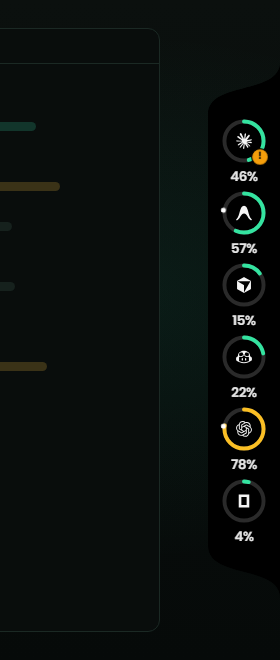
Folded, open, and waiting on you
Screenshots of the real widget over demo data, docked to the right edge.
Install. Configure. Keep your agents in view.
Connect your agents
Review locally detected tools and available usage sources. Enable the integrations and permissions you want to use.
Watches active sessions
Supported hooks report session activity to the local monitoring service. Missing usage fields stay unavailable.
Respond without switching
Use the widget for a quick view, then open the dashboard or return to the original agent session when action is needed.
The whole picture when you want it.
Explore usage readings, agent sessions, account profiles, activity and monitoring settings in one dashboard.
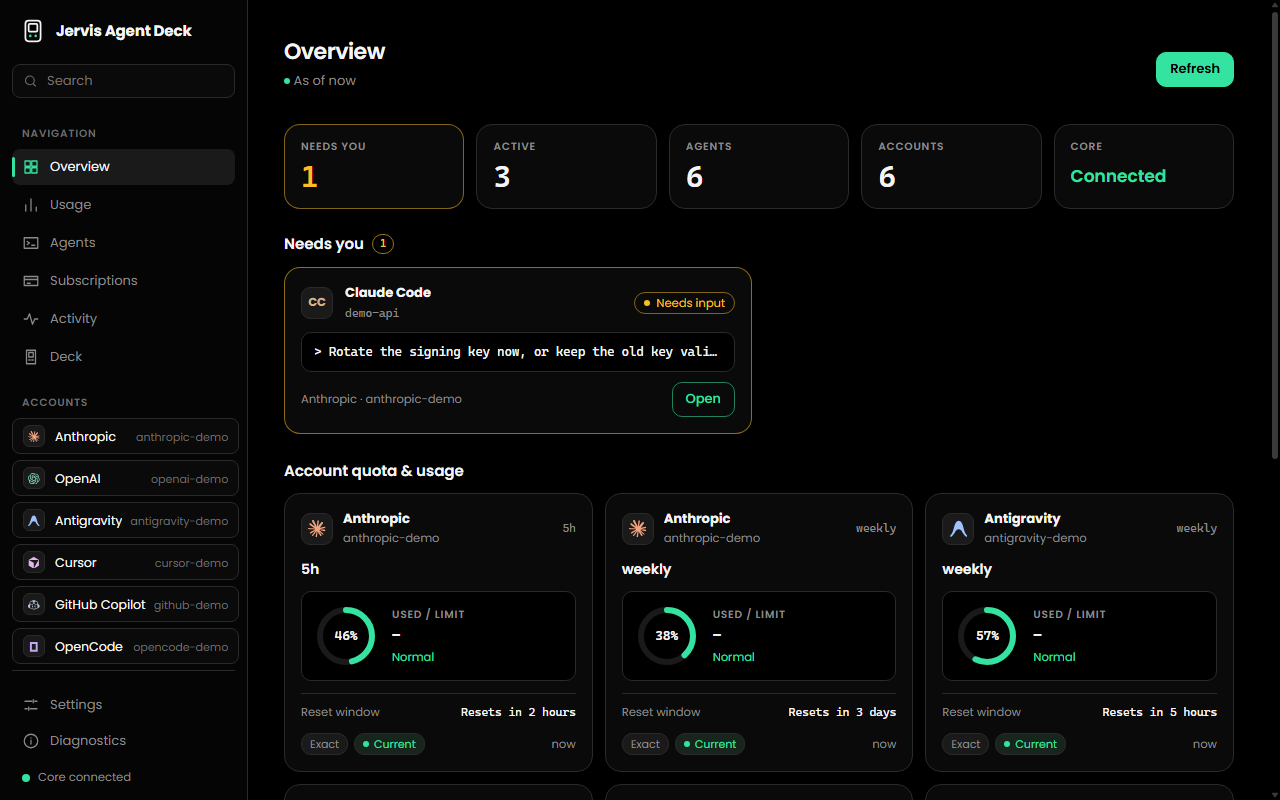
The real Dashboard, captured with demo data.
Jervis Agent Deck, on your machine.
The widget and the Dashboard in one desktop app for Windows, macOS and Linux. Monitoring runs locally. Optional provider requests are controlled in Settings.
Windows
Windows 10 / 11, 64-bit. Not code-signed yet, so SmartScreen may ask you to confirm.
macOS
Unsigned preview build. See the Downloads page for installation notes and platform status.
Linux
x86_64. AppImage runs on most distributions; .deb for Debian and Ubuntu.
It never guesses a number.
Readings come from available local sources and configured integrations. Missing or ambiguous values stay unavailable.
REAL DATA
If a source does not report a usable value, we label it Unknown. No synthetic assumptions, no fake hallucinated usage gauges.
LOCAL FIRST
Development data remains on your computer whenever possible. Your source code, local process state, and configuration stay directly on your machine without mandatory cloud routing.
YOU CONTROL IT
Choose monitoring permissions in Settings. Jervis Agent Deck displays supported requests; your agent retains its own execution controls.
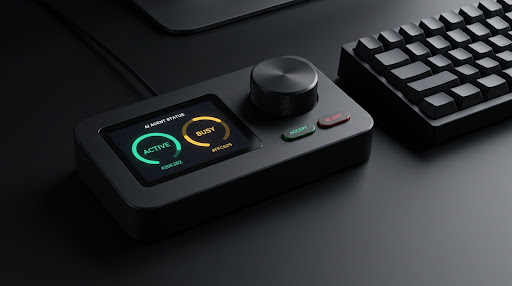
The Deck.
A planned companion with a display, rotary dial and action buttons. These renders illustrate the design direction. Physical hardware and firmware are still in development; specifications and availability are not final.
Your agents are working. Keep them in sight.
Download the free desktop preview and choose how the widget fits your workflow. The physical companion is still in development.
Frequently asked questions
Is the desktop app free?
Yes. The desktop preview is free and does not require a Jervis account.
Do I need the physical Deck?
No. The widget and dashboard work independently. Hardware is still in development.
Why is a usage value unavailable?
Some tools do not expose a usable quota value. The app displays unknown values honestly rather than inventing a percentage.
How do I open the dashboard?
Launch Jervis Agent Deck from your desktop or Start menu shortcut. While it is running, Ctrl/Cmd+Shift+J opens the dashboard.
Which integrations report sessions?
Claude Code, Codex, Copilot CLI and OpenCode integration code is included. Enable and install integrations in Settings; support and available metrics vary by tool.